The Real Time Graph


Why are we doing this?


Sarah came to the group wanting to find a way to help advance the technology around the diabetes community. Currently her set up is the only FDA approved closed loop system, the Medtronic 670G. However, she has run into numerous issues with this auto mode. The problem with this pump is that there have to be so many safety features installed to protect the general public from too many low blood sugars. While it is important to have those features, those features demote the purpose of auto-mode. The auto-mode is so slow to respond because it doesn't want to react too rapidly and cause a low blood sugar. However, then because of that most of the time Sarah's blood sugars are out of range and she has to fix it manually anyway.

After a few months on the auto-mode she had to turn it off and return to the manual mode that she was trying to get away from. While Medtronic has recognized these issues, the time it takes for a new pump model ` to come out and be approved by the FDA will take years.

Type One Diabetes is a lifelong fight to balance treatments, blood sugars, food and exercise. If there is any tool that can help alleviate the stress of balancing all this, we want to find it! Our main inspiration came from the OpenAPS community. A group of programmers created their own artificial pancreas through Python code on a Raspberry Pi that connects to old models of insulin pumps that have open radio channels. Intially we wanted to see if there was any code we could improve. The algorithm that decides the insulin rates turned out much more complex than anticipated. However, we found a wealth of data in the form of blood sugar readings and changing insulin rates. We decided we wanted to improve the way OpenAPS and NightScouts graphs its data. We wanted to have a graph that is easier to share with a doctor and a modern design that is running off the information we gathered from our old pump/Pi build. This page showcases all the moving parts to build this graph.


What does 'closed loop' mean?

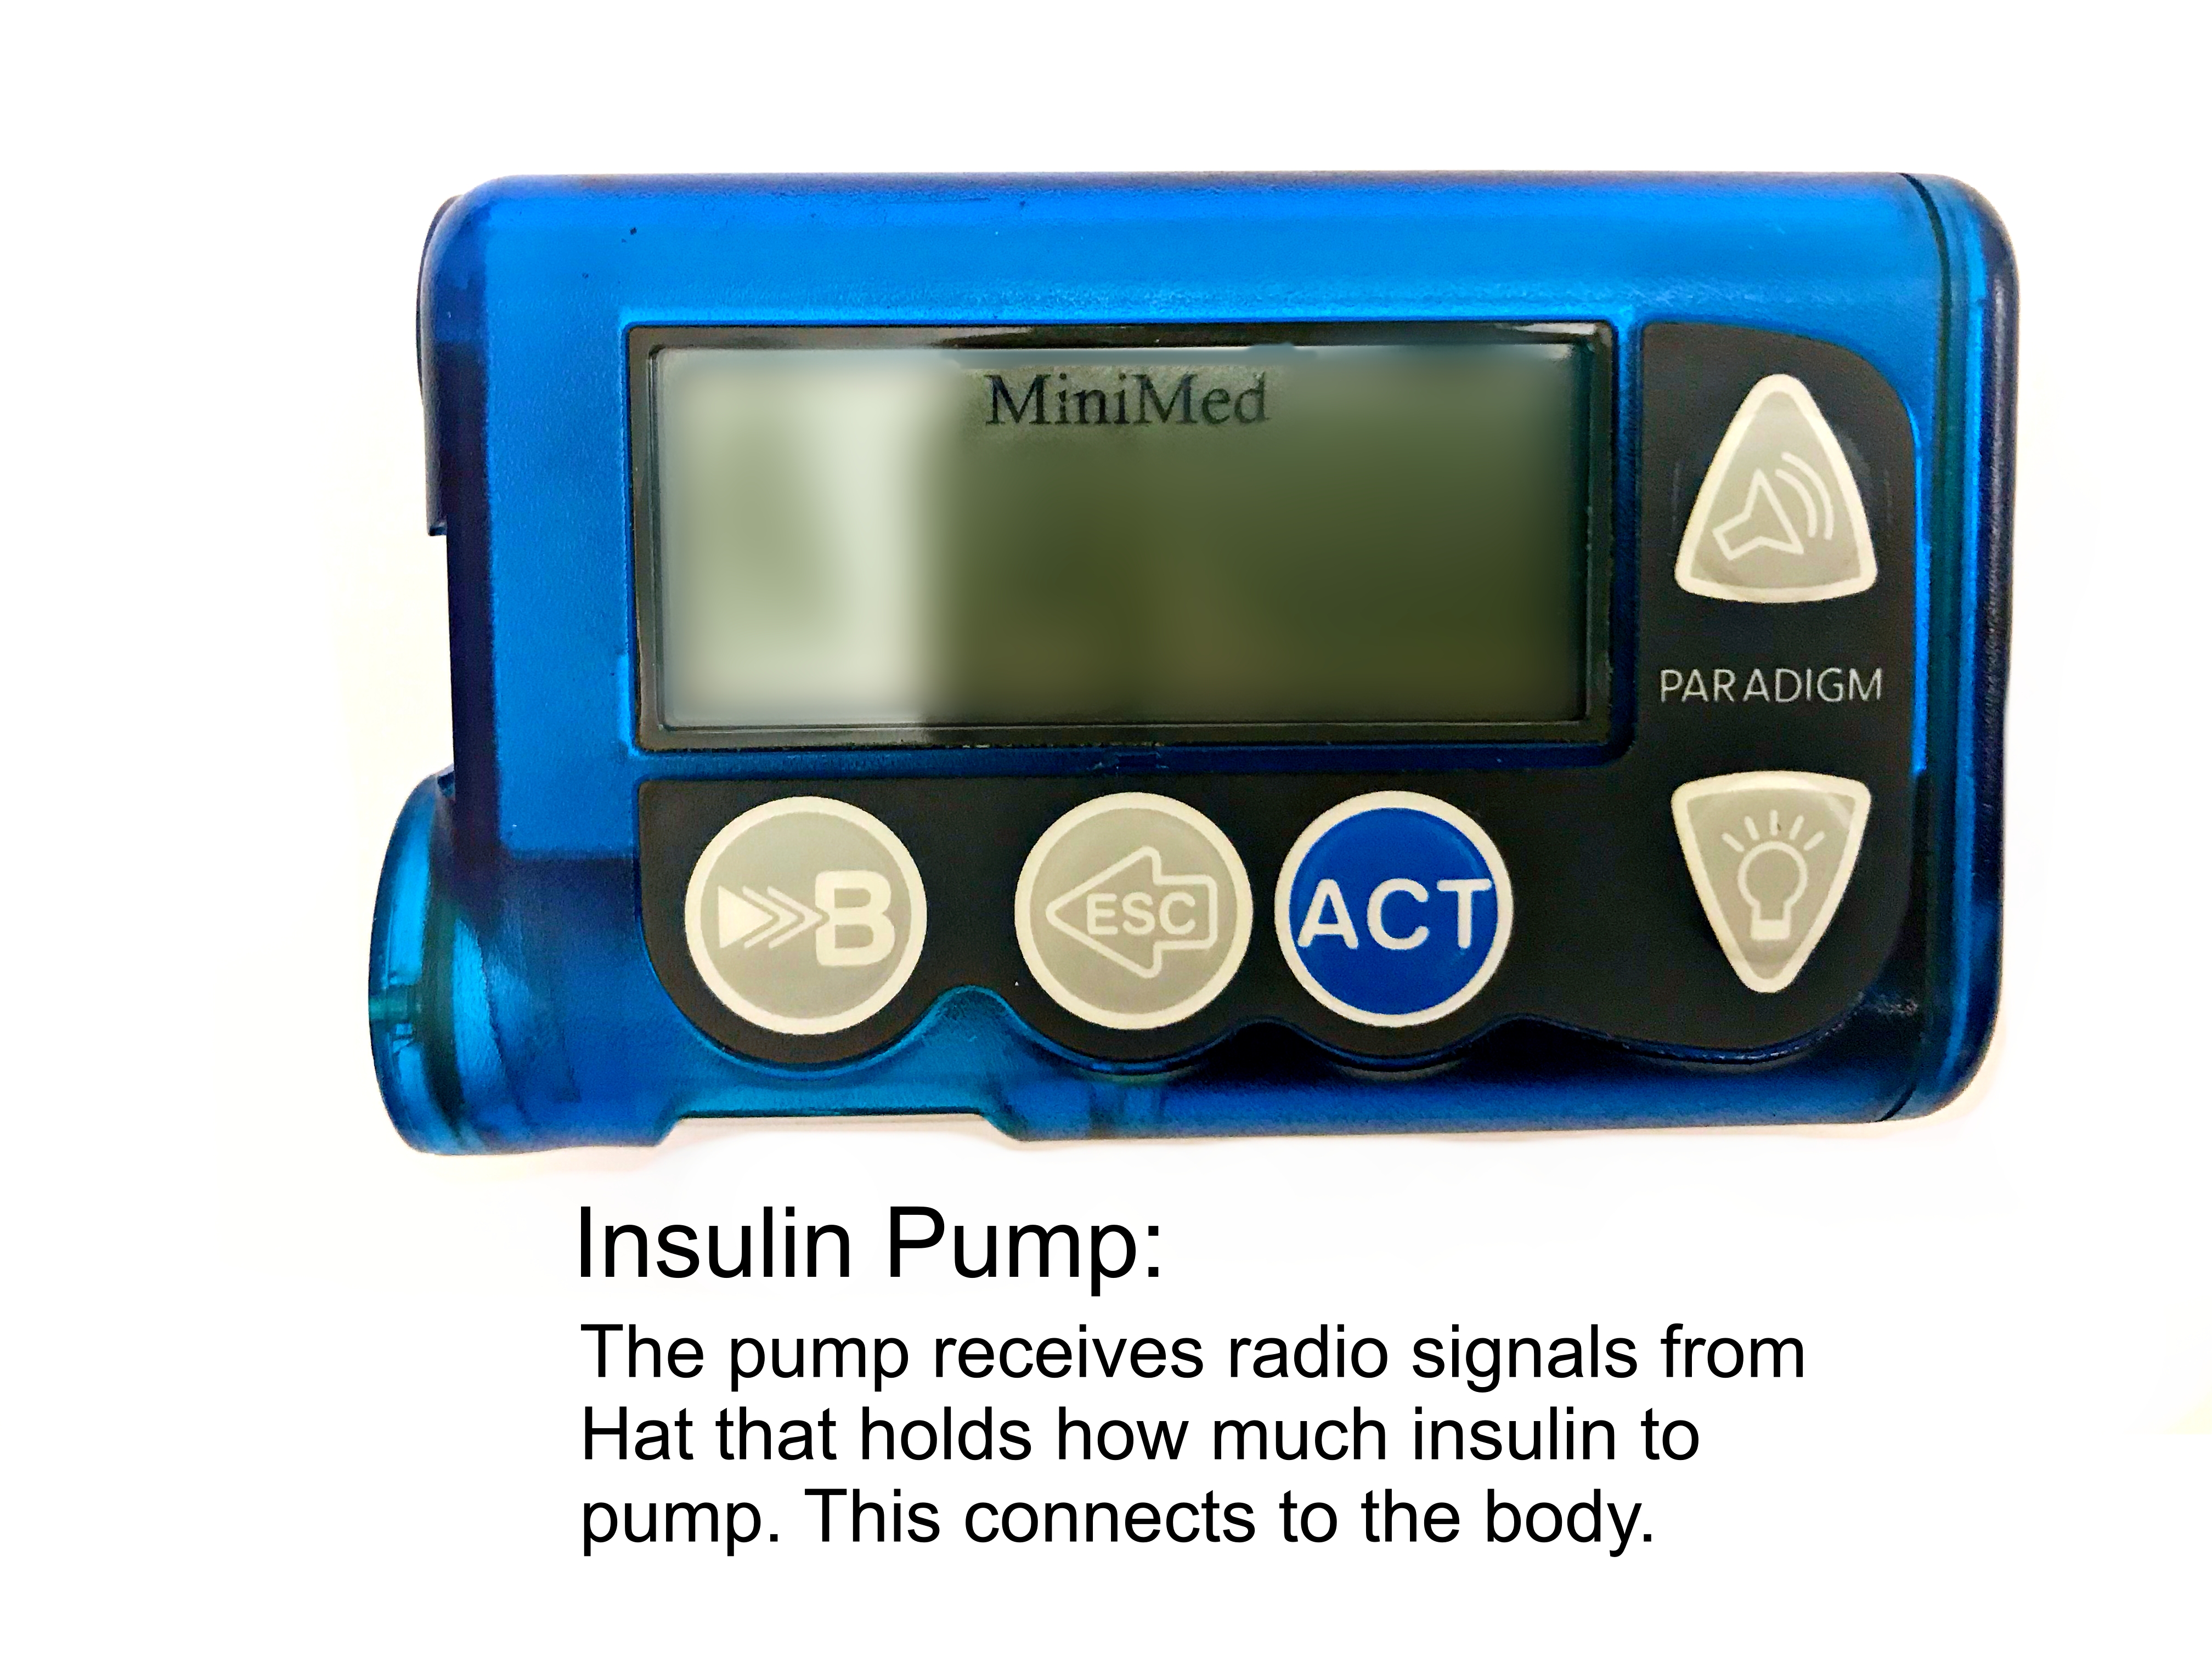
Currently there is only one closed loop insulin pump on the market that the FDA approves of, the Medtronic 670G. What makes a closed loop insulin pump different from the regular insulin pumps is its "auto-mode". Auto-mode takes over the decision making for basal rates. A basal rate is the continous stream of insulin to control blood sugars 24 hours a day.

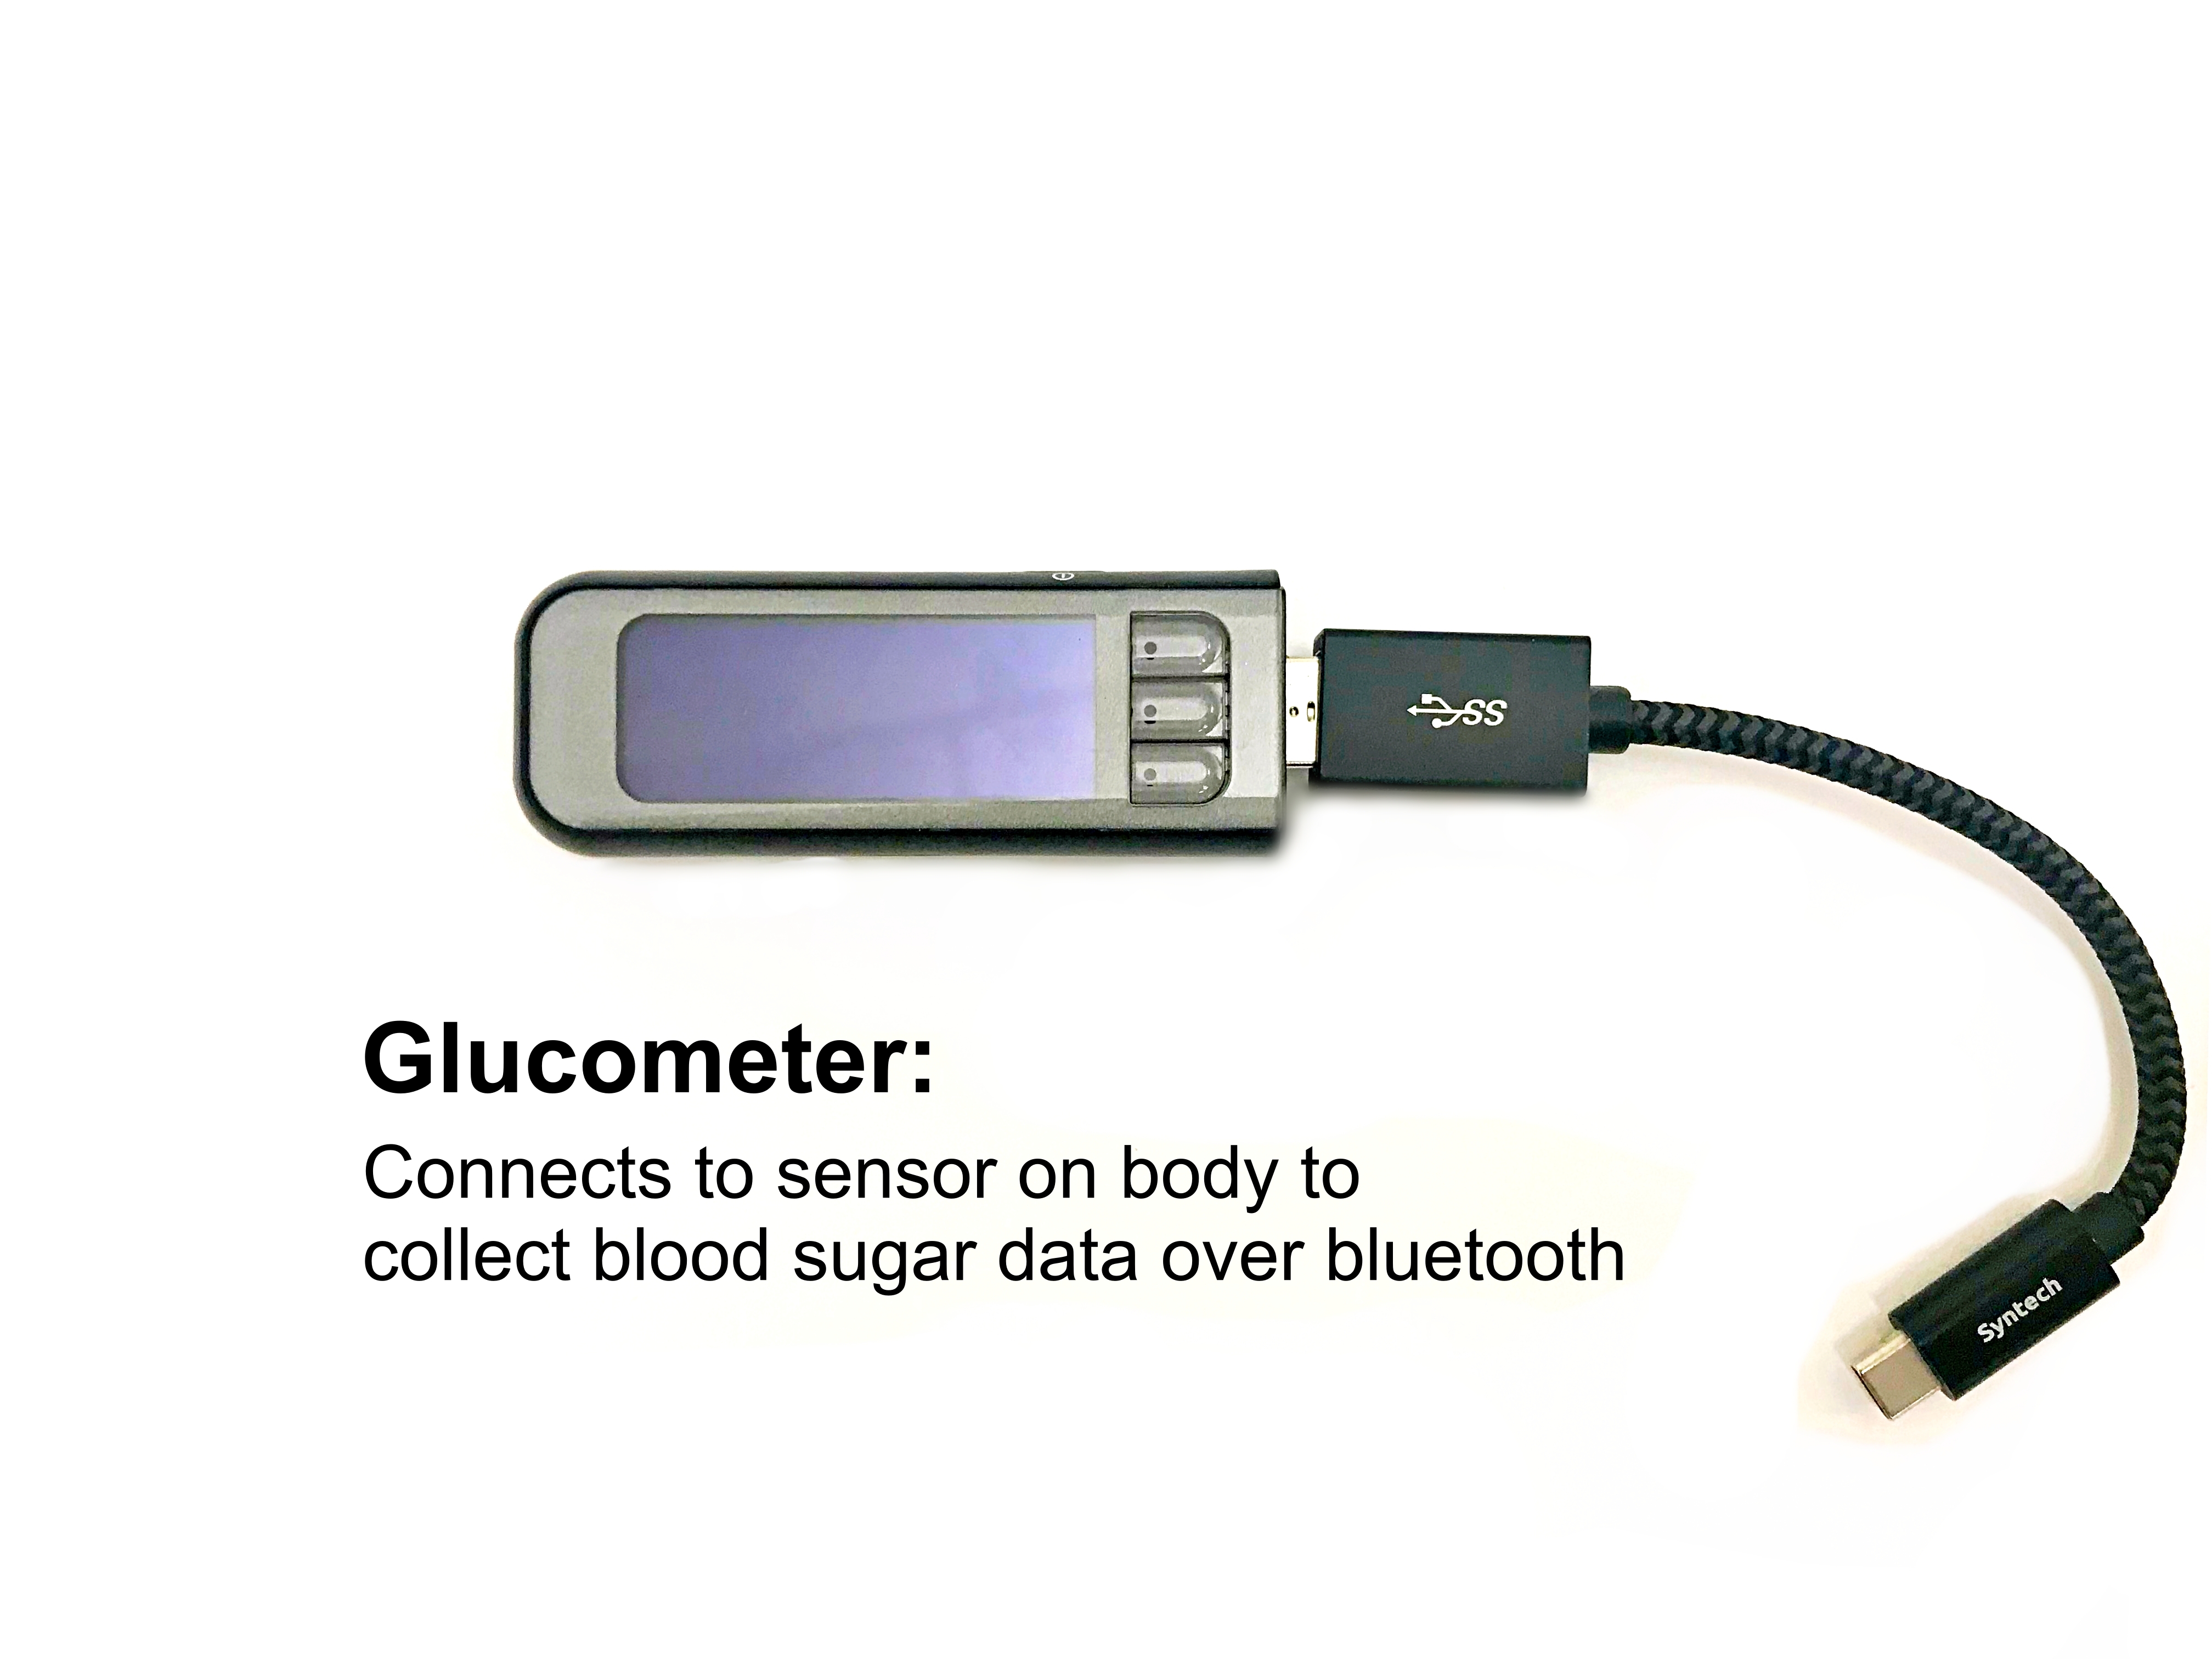
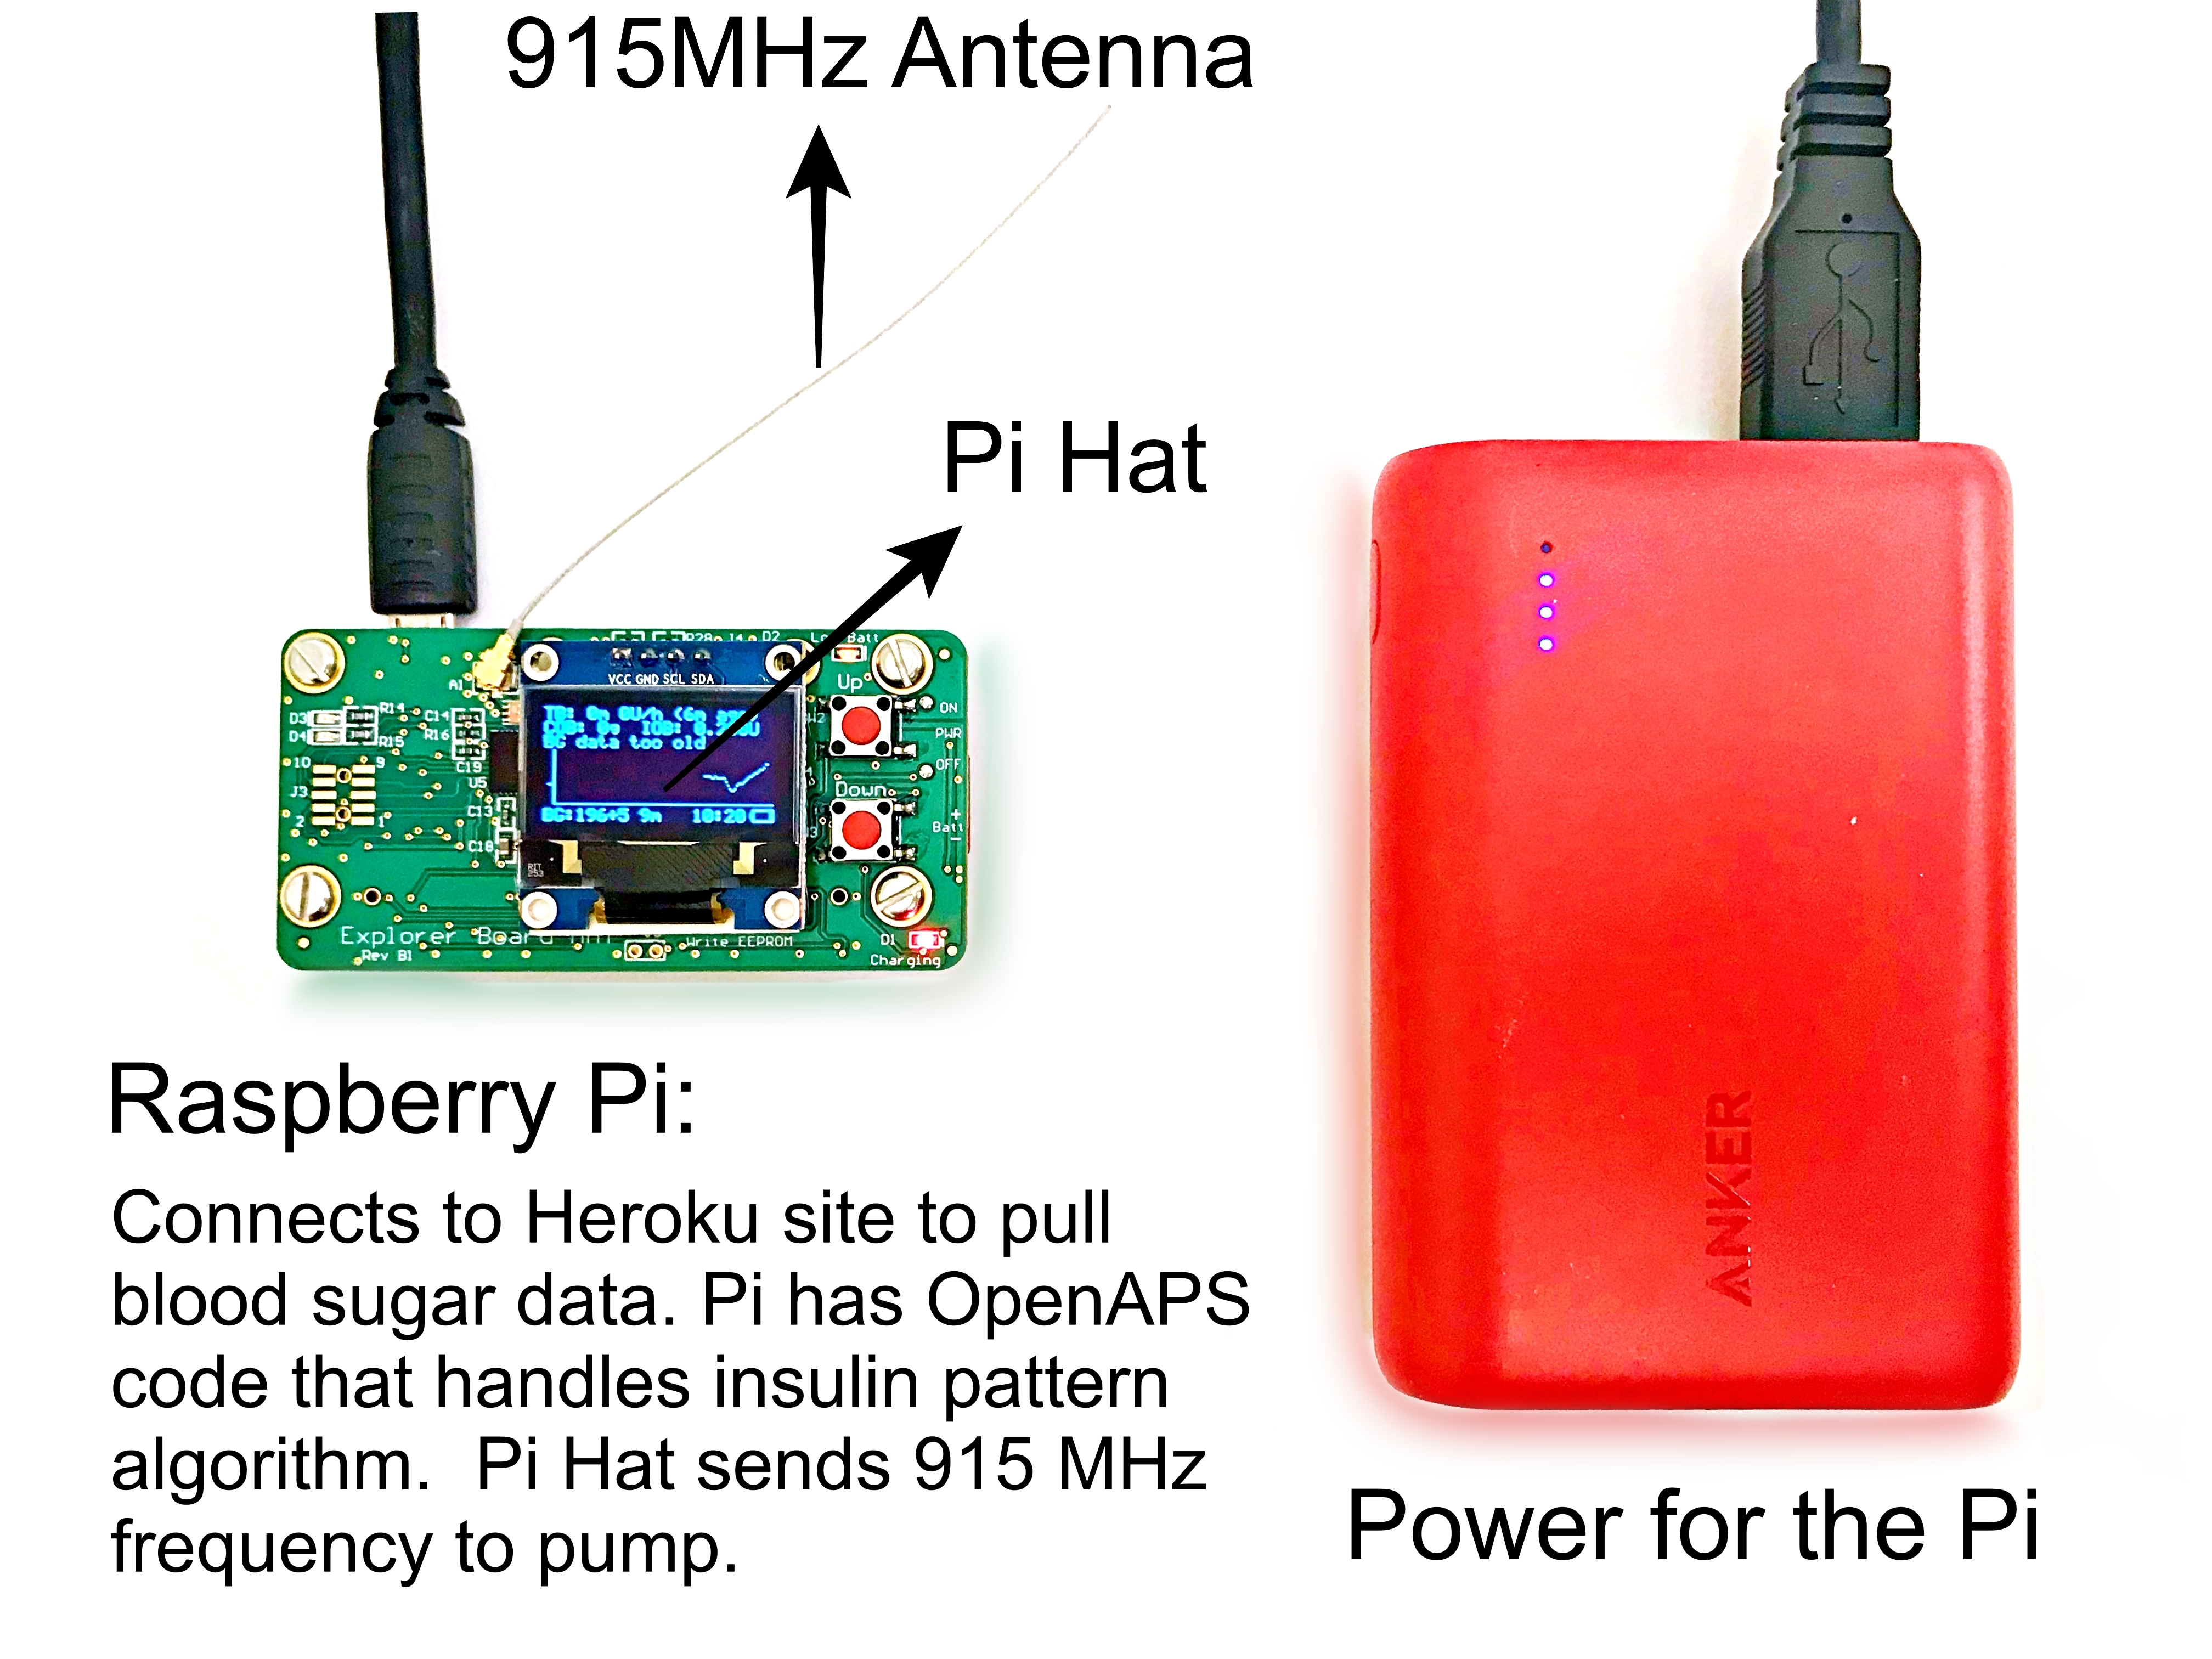
In the open loop systems the patient and their doctor have to decide the basal rates, and play a long game of guess and check to see if the basal is too high (too much insulin) or too low (too little insulin). A closed loop system uses a continous glucose monitor (CGM) that is worn by the patient 24/7 and pulls blood sugar values from the interstital fluid. The pump then takes that blood sugar value and runs it through an algorithm. That algorithm decides how much insulin the pump should push out.

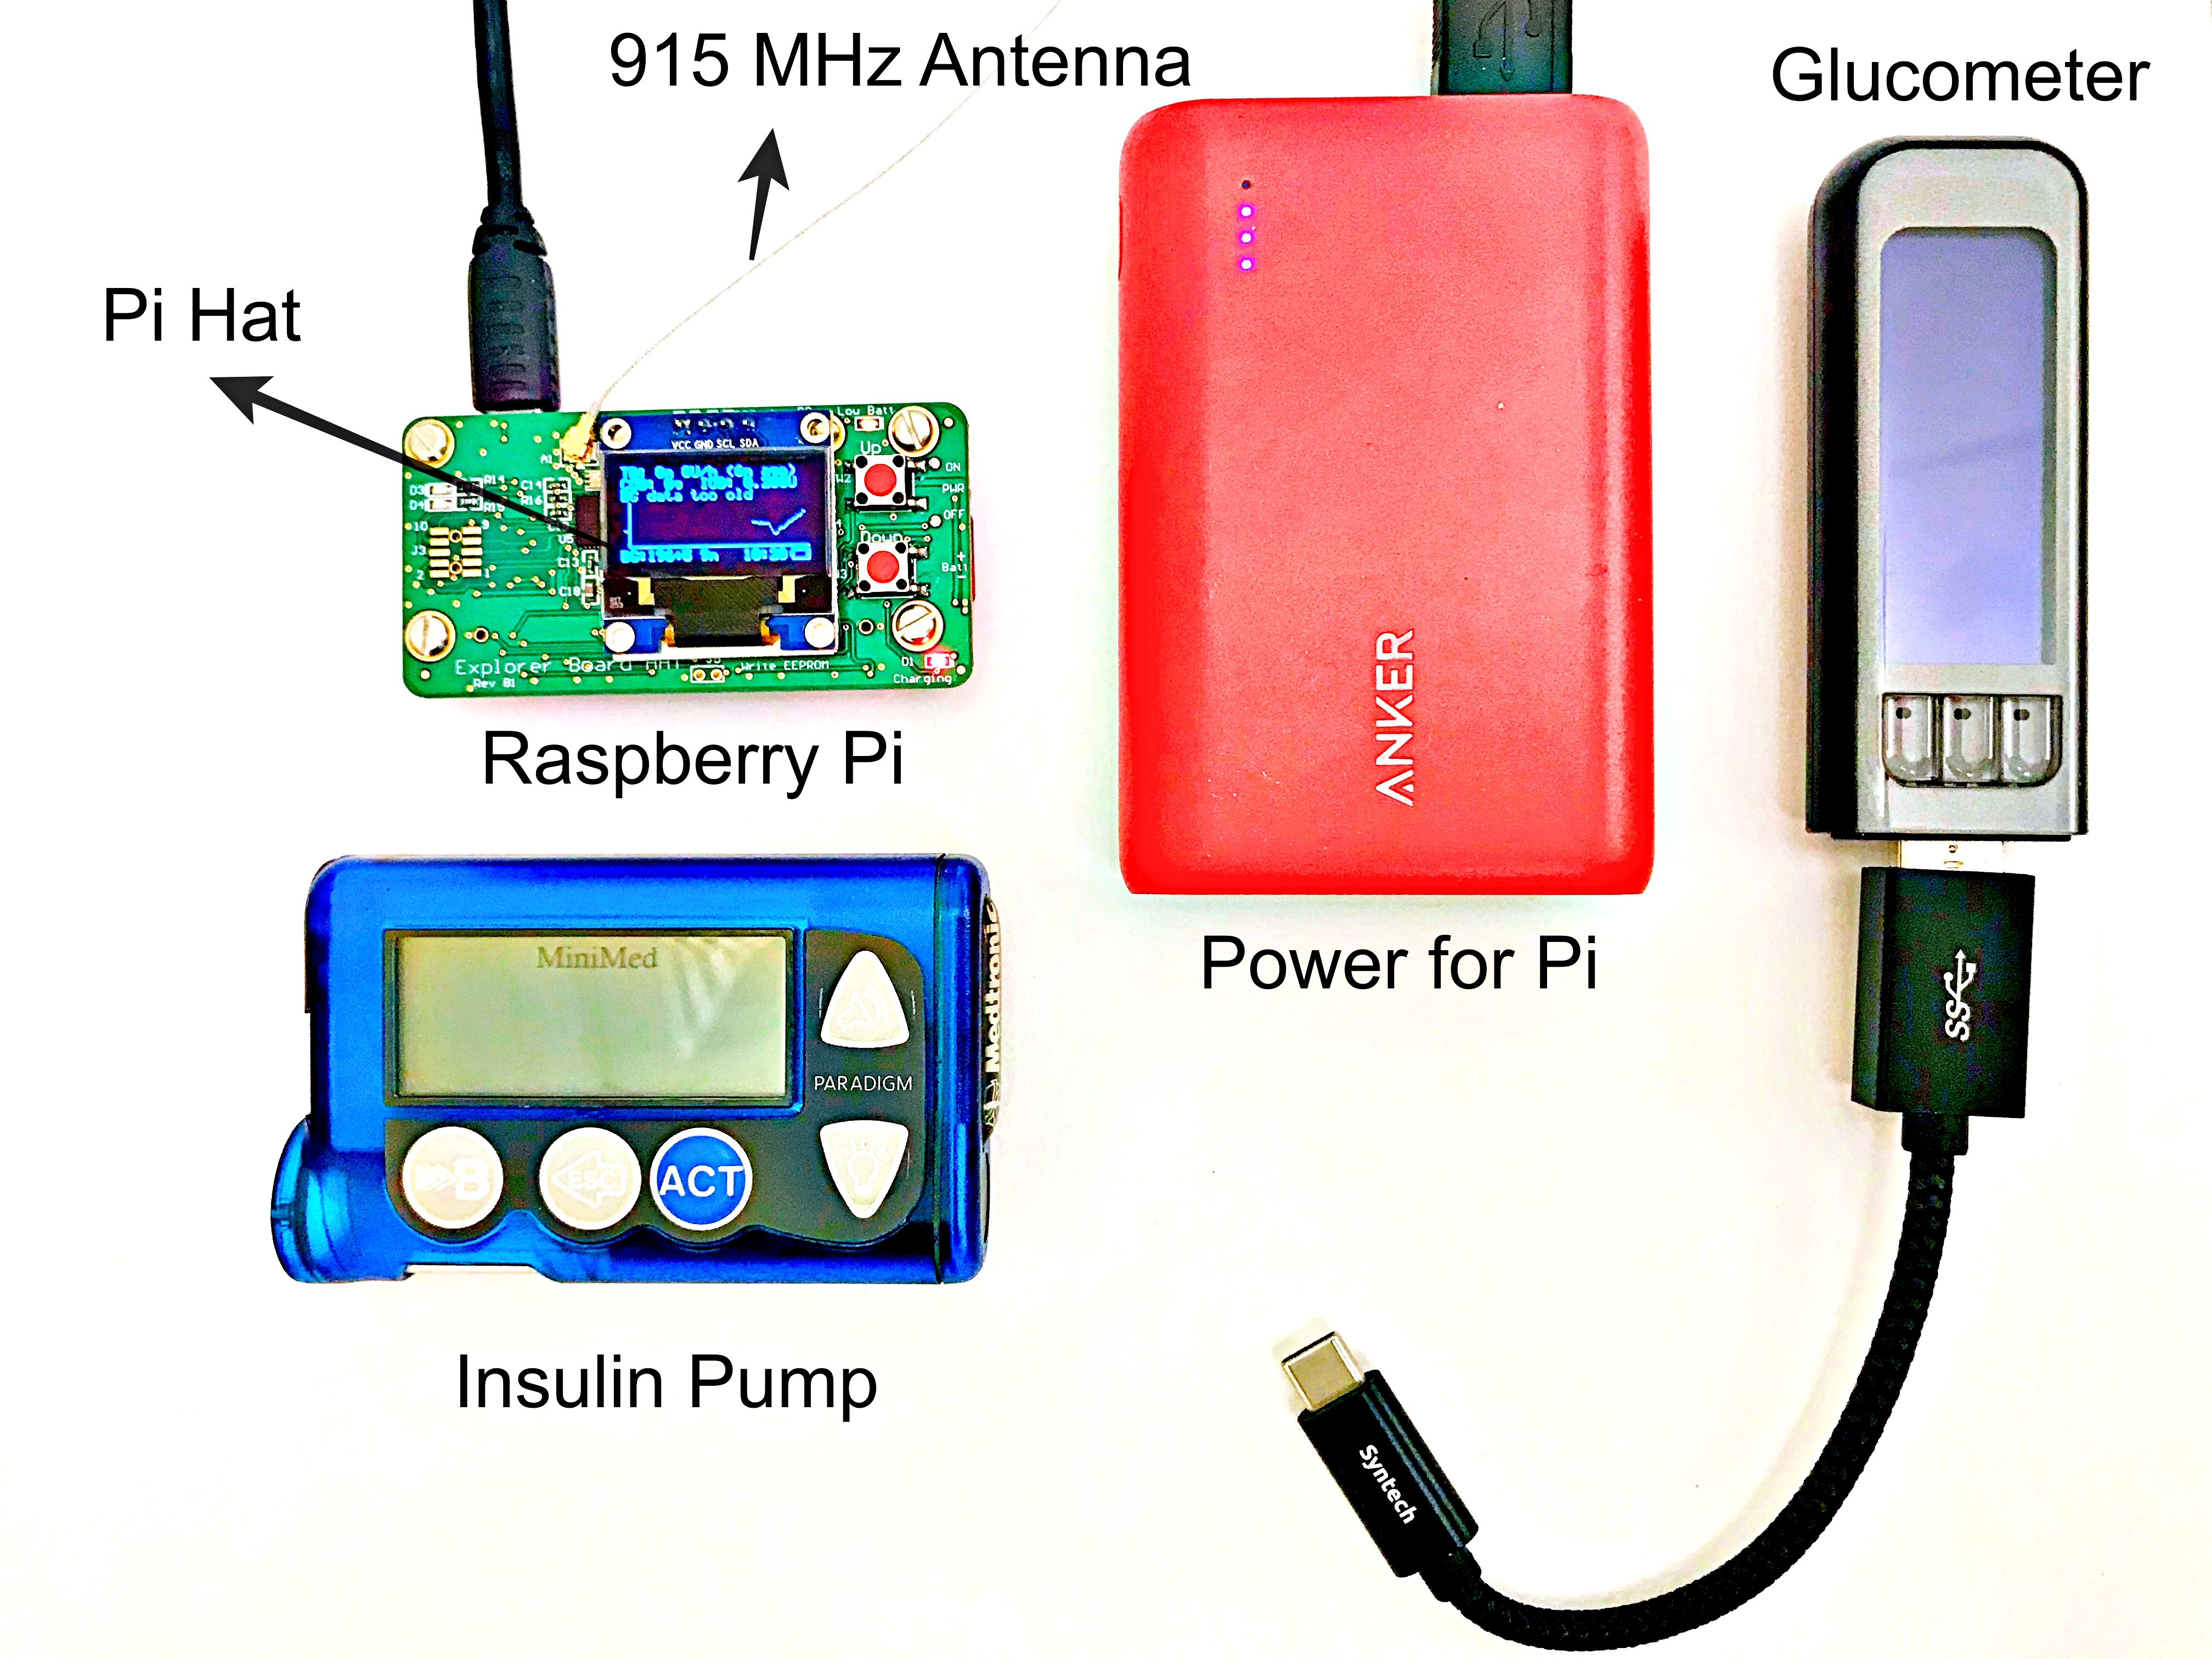
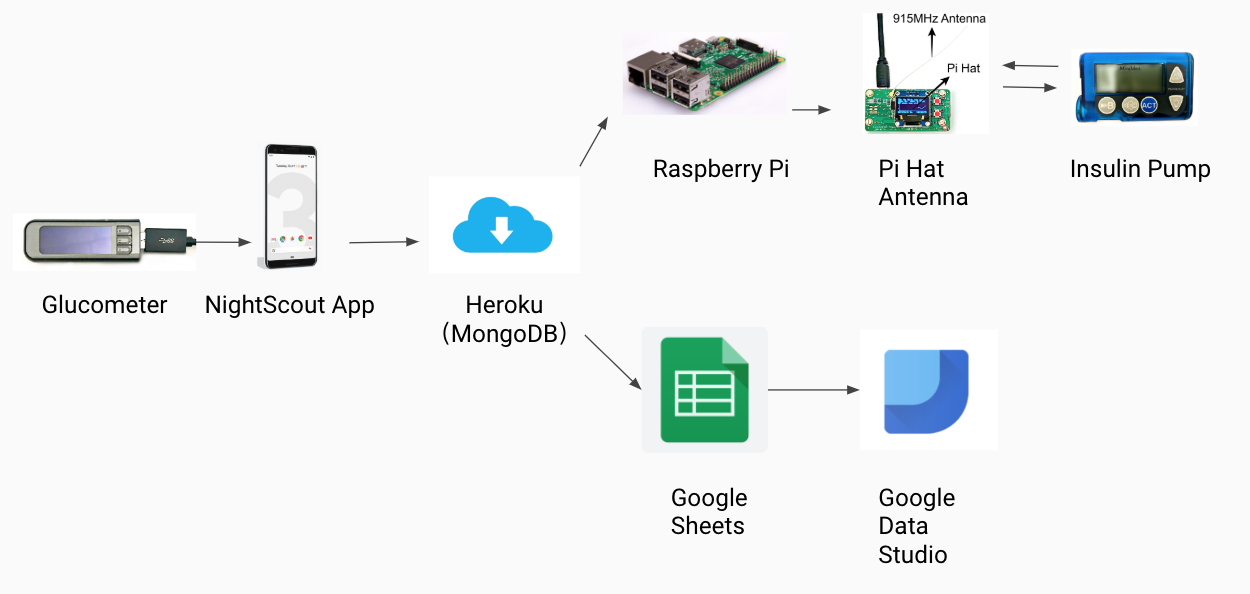
As mentioned above, there is only one closed loop system out that is approved by the FDA. However, many diabetics took technology in their own hands and created their own closed loop system with the hardware listed above. This hacked version is more accurate and the patient can see the changed rates.


How do we Loop?


The hardware side...

We started off this project with the idea to create our own real-time graph based off the changes an OpenAPS insulin pump would make in the insulin rates throughout the day and how it correlates to blood sugar trends. To start the project off we followed the OpenAPS guide to build a hacked insulin pump.

A Raspberry Pi Zero with headers, an Explorer Pi HAT, a 915 mgHZ antenna, a battery bank, a Medtronic 512 insulin pump, a glucometer and many wires create the hacked closed loop system. You can find the instructions to put all these pieces together on the OpenAPS documentation page.


Step by Step...


The Glucometer

The Pi with Explorer HAT

The Insulin Pump

The loop begins with Sarah's glucometer. The glucometer takes blood sugar data from the sensor Sarah wears on her arm 24/7. The blood sugars are then transferred through an OTG cable to a phone. On the phone is NightScout's app. The data transfer will be discussed in more detail below, for now let's focus on the hardware.

Once all the bloodsugar data is in the cloud it is then pulled back down. The Pi Zero has the OpenAPS python code downloaded on it. Through that alogorithm, the Pi then connects to its Explorer HAT. The HAT sits on top of the Pi and allows communication through a 915 mgHZ antenna to the Medtronic 512 pump. The HAT has an LED screen with buttons that allow the user to view the current bloodsugar, time and graph of blood sugar trends. All of this is powered by a battery bank and runs on Wi-Fi.

The pump picks up on the signals sent from the Pi HAT and pumps out the amount of insulin that the openAPS algorithm decided upon.


Where does data come from?

And where does it go?


Here is the cycle of data across the hardware, database, and into our graphs.

Now that we understand how the hardware loops, let's talk about the data. As mentioned above, the loop starts at the glucometer. Blood sugar data is pulled from the glucometer and is entered into an Android app on a phone through an OTG cable. The NightScouts Android app takes the readings and sends them up into the cloud to a Heroku cloud-based site. This Heroku site was created by running a script from the OpenAPS Github. The script from OpenAPS creates a Mongo Database at the same time as the Heroku site. With the Mongo database set up, all the data coming from the mobile app has a place to be stored. Here is where the data flow breaks off into two areas.

The first flow starts from Mongo and the Heroku site, and blood sugar data is pulled back down from the cloud to the Pi. The Pi is able to do this through the Python coded written on its SD card from OpenAPS. The data is run through OpenAPS' algorithm and that data is sent through the Pi to the HAT to the insulin pump and that cycles over and over for each new reading from the glucometer.

The second branch of data is where our project plays its part. We pulled data from Mongo through a Python API PyMongo. We took the values for the date, time, insulin rates, and blood sugar values out of the database and inserted them into a Google Sheet. To insert this data we used the Google Sheets API and the Google Drive API in Python. Once the data is inserted into a spreadsheet, we used Google Data Studios to generate the real time graph you see at the top of this page. The loop keeps going every five minutes. New entry is sent from the glucometer, to the database, through PyMongo, inserted into Google Sheets, and Data Studios updates its graph. All automated.


Let's talk expansion...

This is the progress we've made over the course of 4-5 weeks of our semester in Intro to Programming. We learned many new skills that we can definitely expand on. The point we are at now with this project is a great launch pad for more diabetes tech expansion. Given more time we would like to create an app for school teachers that connects to our Data Studio chart. Since there are regulations on medical records of students, a teacher might not be able to look at a students direct blood sugar numbers, however our app idea would use a light system. We set parameters on when a student's blood sugar is in range and the light stays green. When the student's blood sugars is too low or high the light will change to a different color. This allows for the teacher to be in the know, as well as protecting the students privacy.