Hacking Diabetes
A CIS111B Semester Project
Hacking Diabetes
A CIS111B Semester Project
Welcome to our project page! We are students who decided to make a real time bloodsugar graph based off an openAPS hacked insulin pump as our semester project for our intro to programming class!
By using data pulled from a glucometer through the NightScouts app we are able to connect that data into a graph with the Google Sheets API.
The data is uploaded from a Mongo Database through Python code into a Google Sheets, then the sheet is run through Google Data Studio to generate this real time graph.
Select the time range you wish to view the bloodsugar trend in.
These are some of the amazing resources we used to create our project. NightScouts and openAPS are our main sources of inspiration.
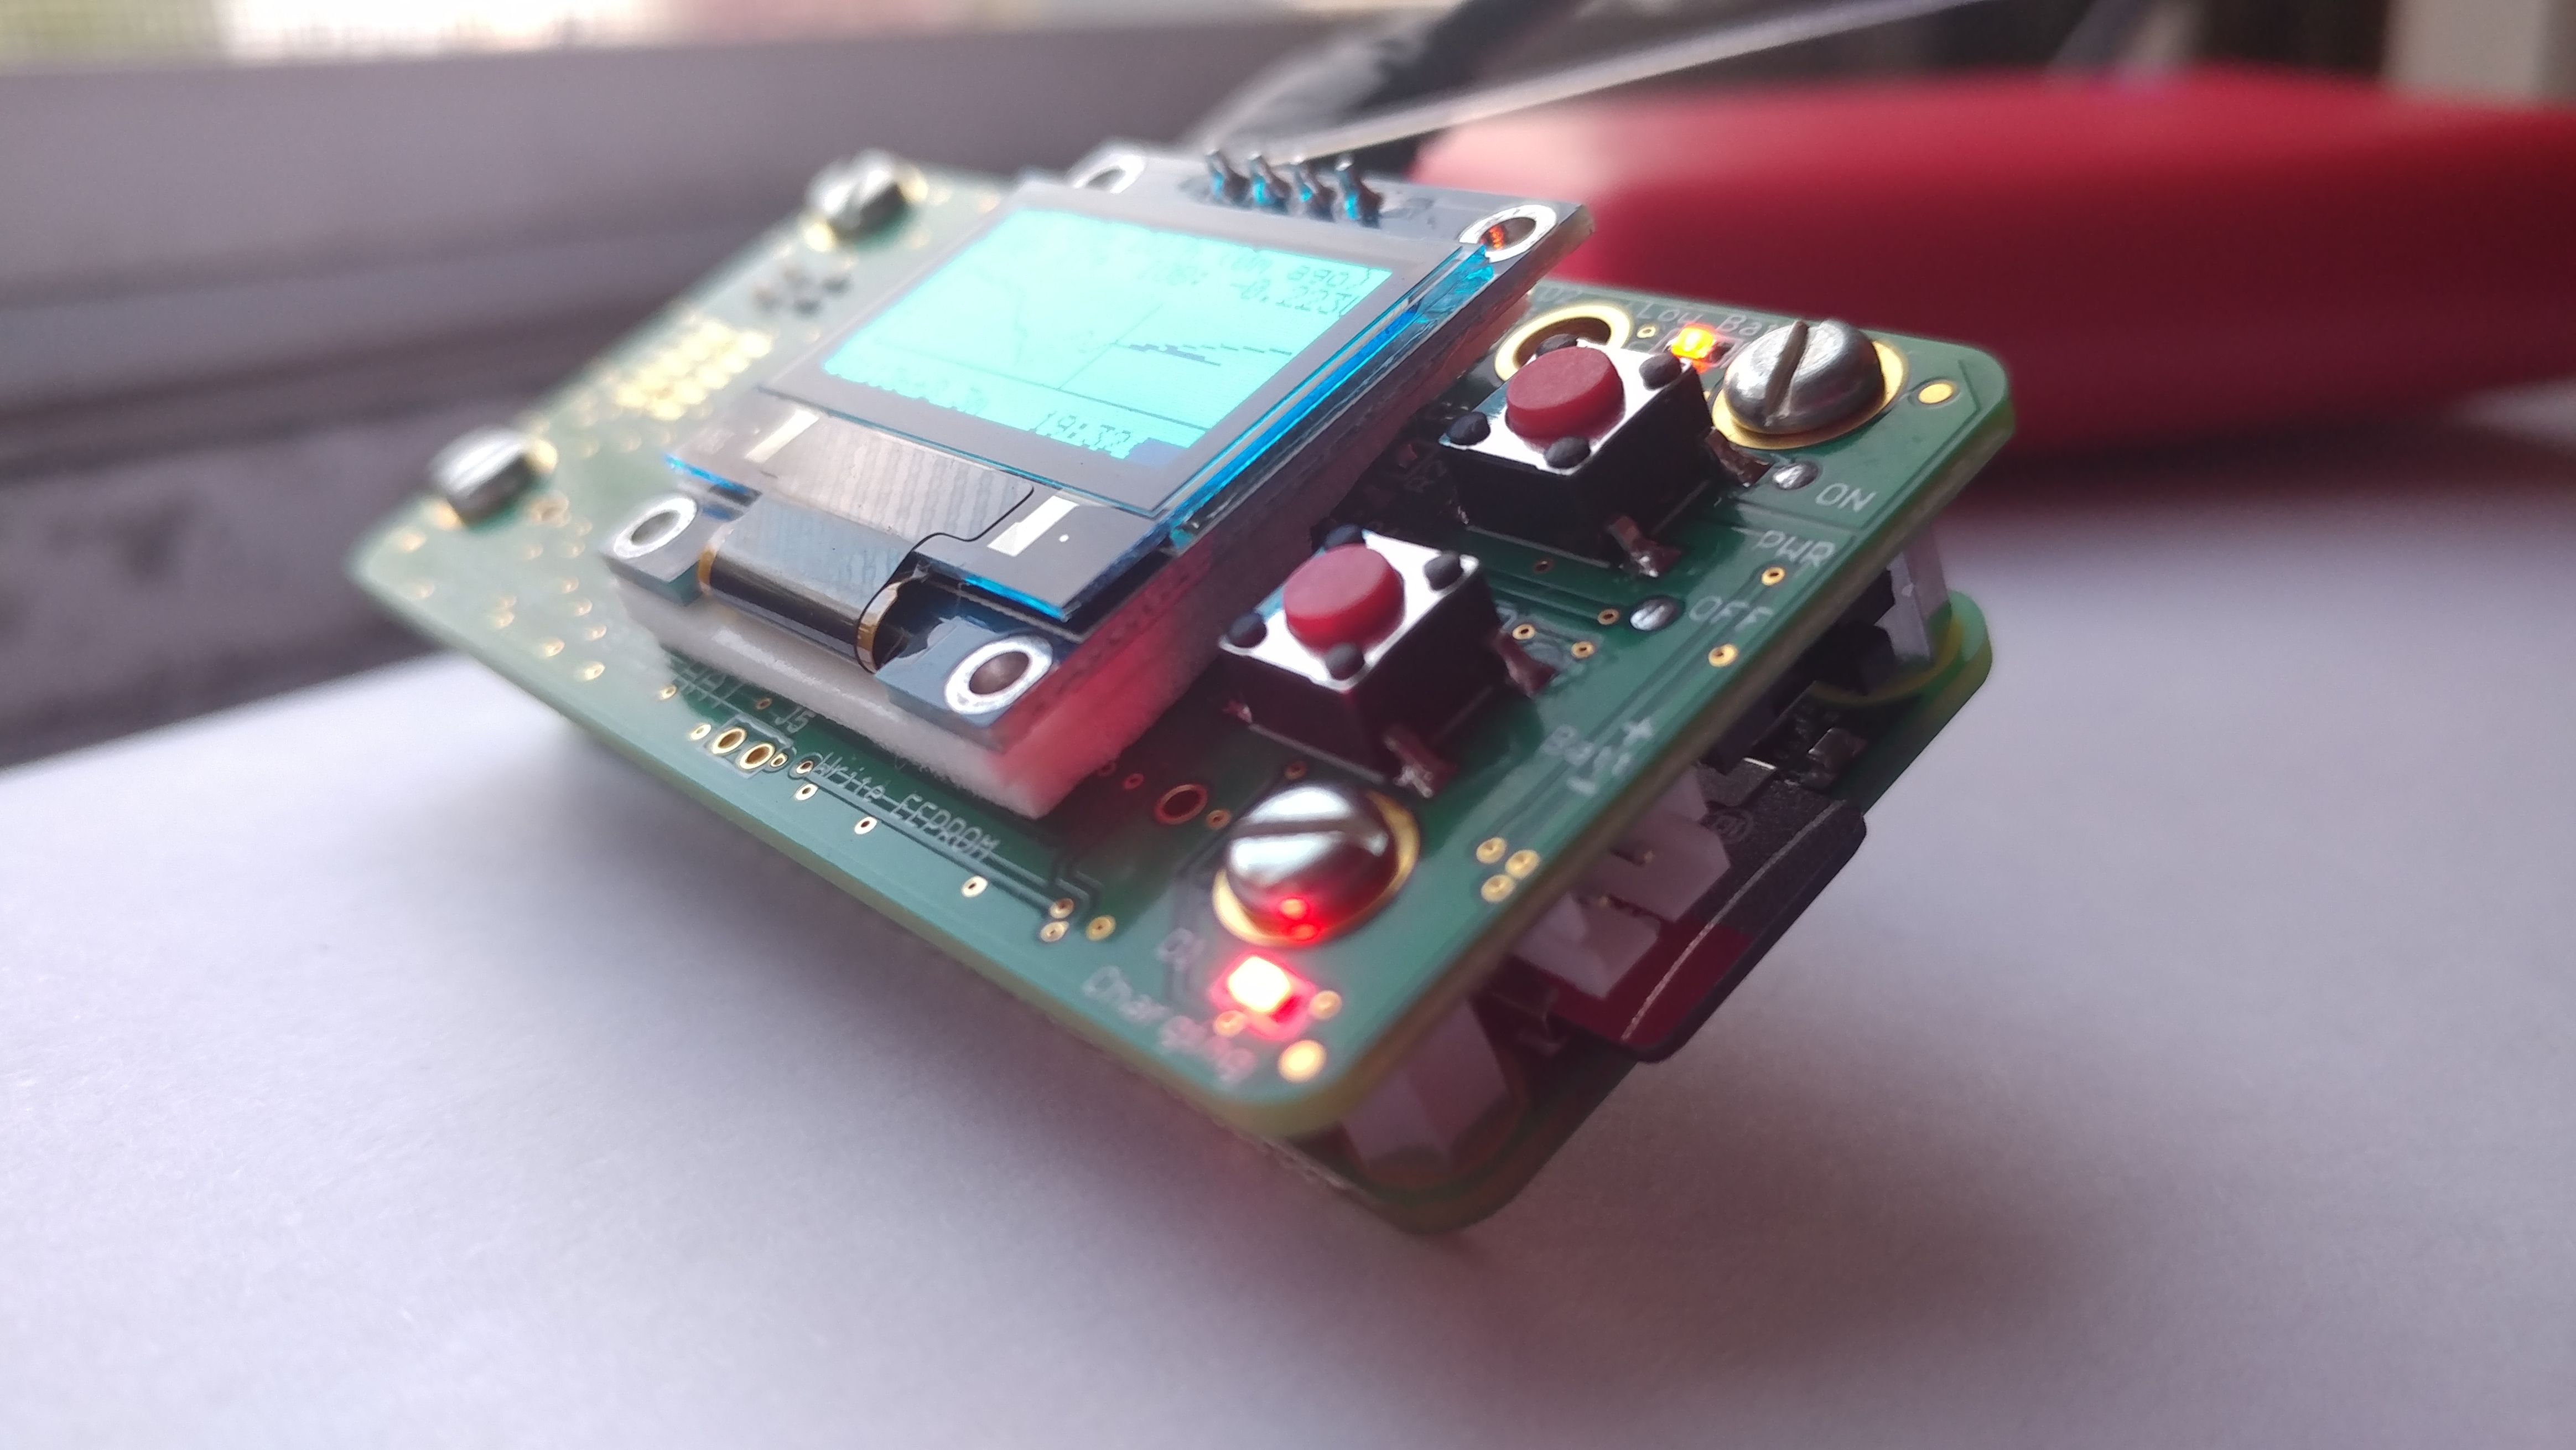
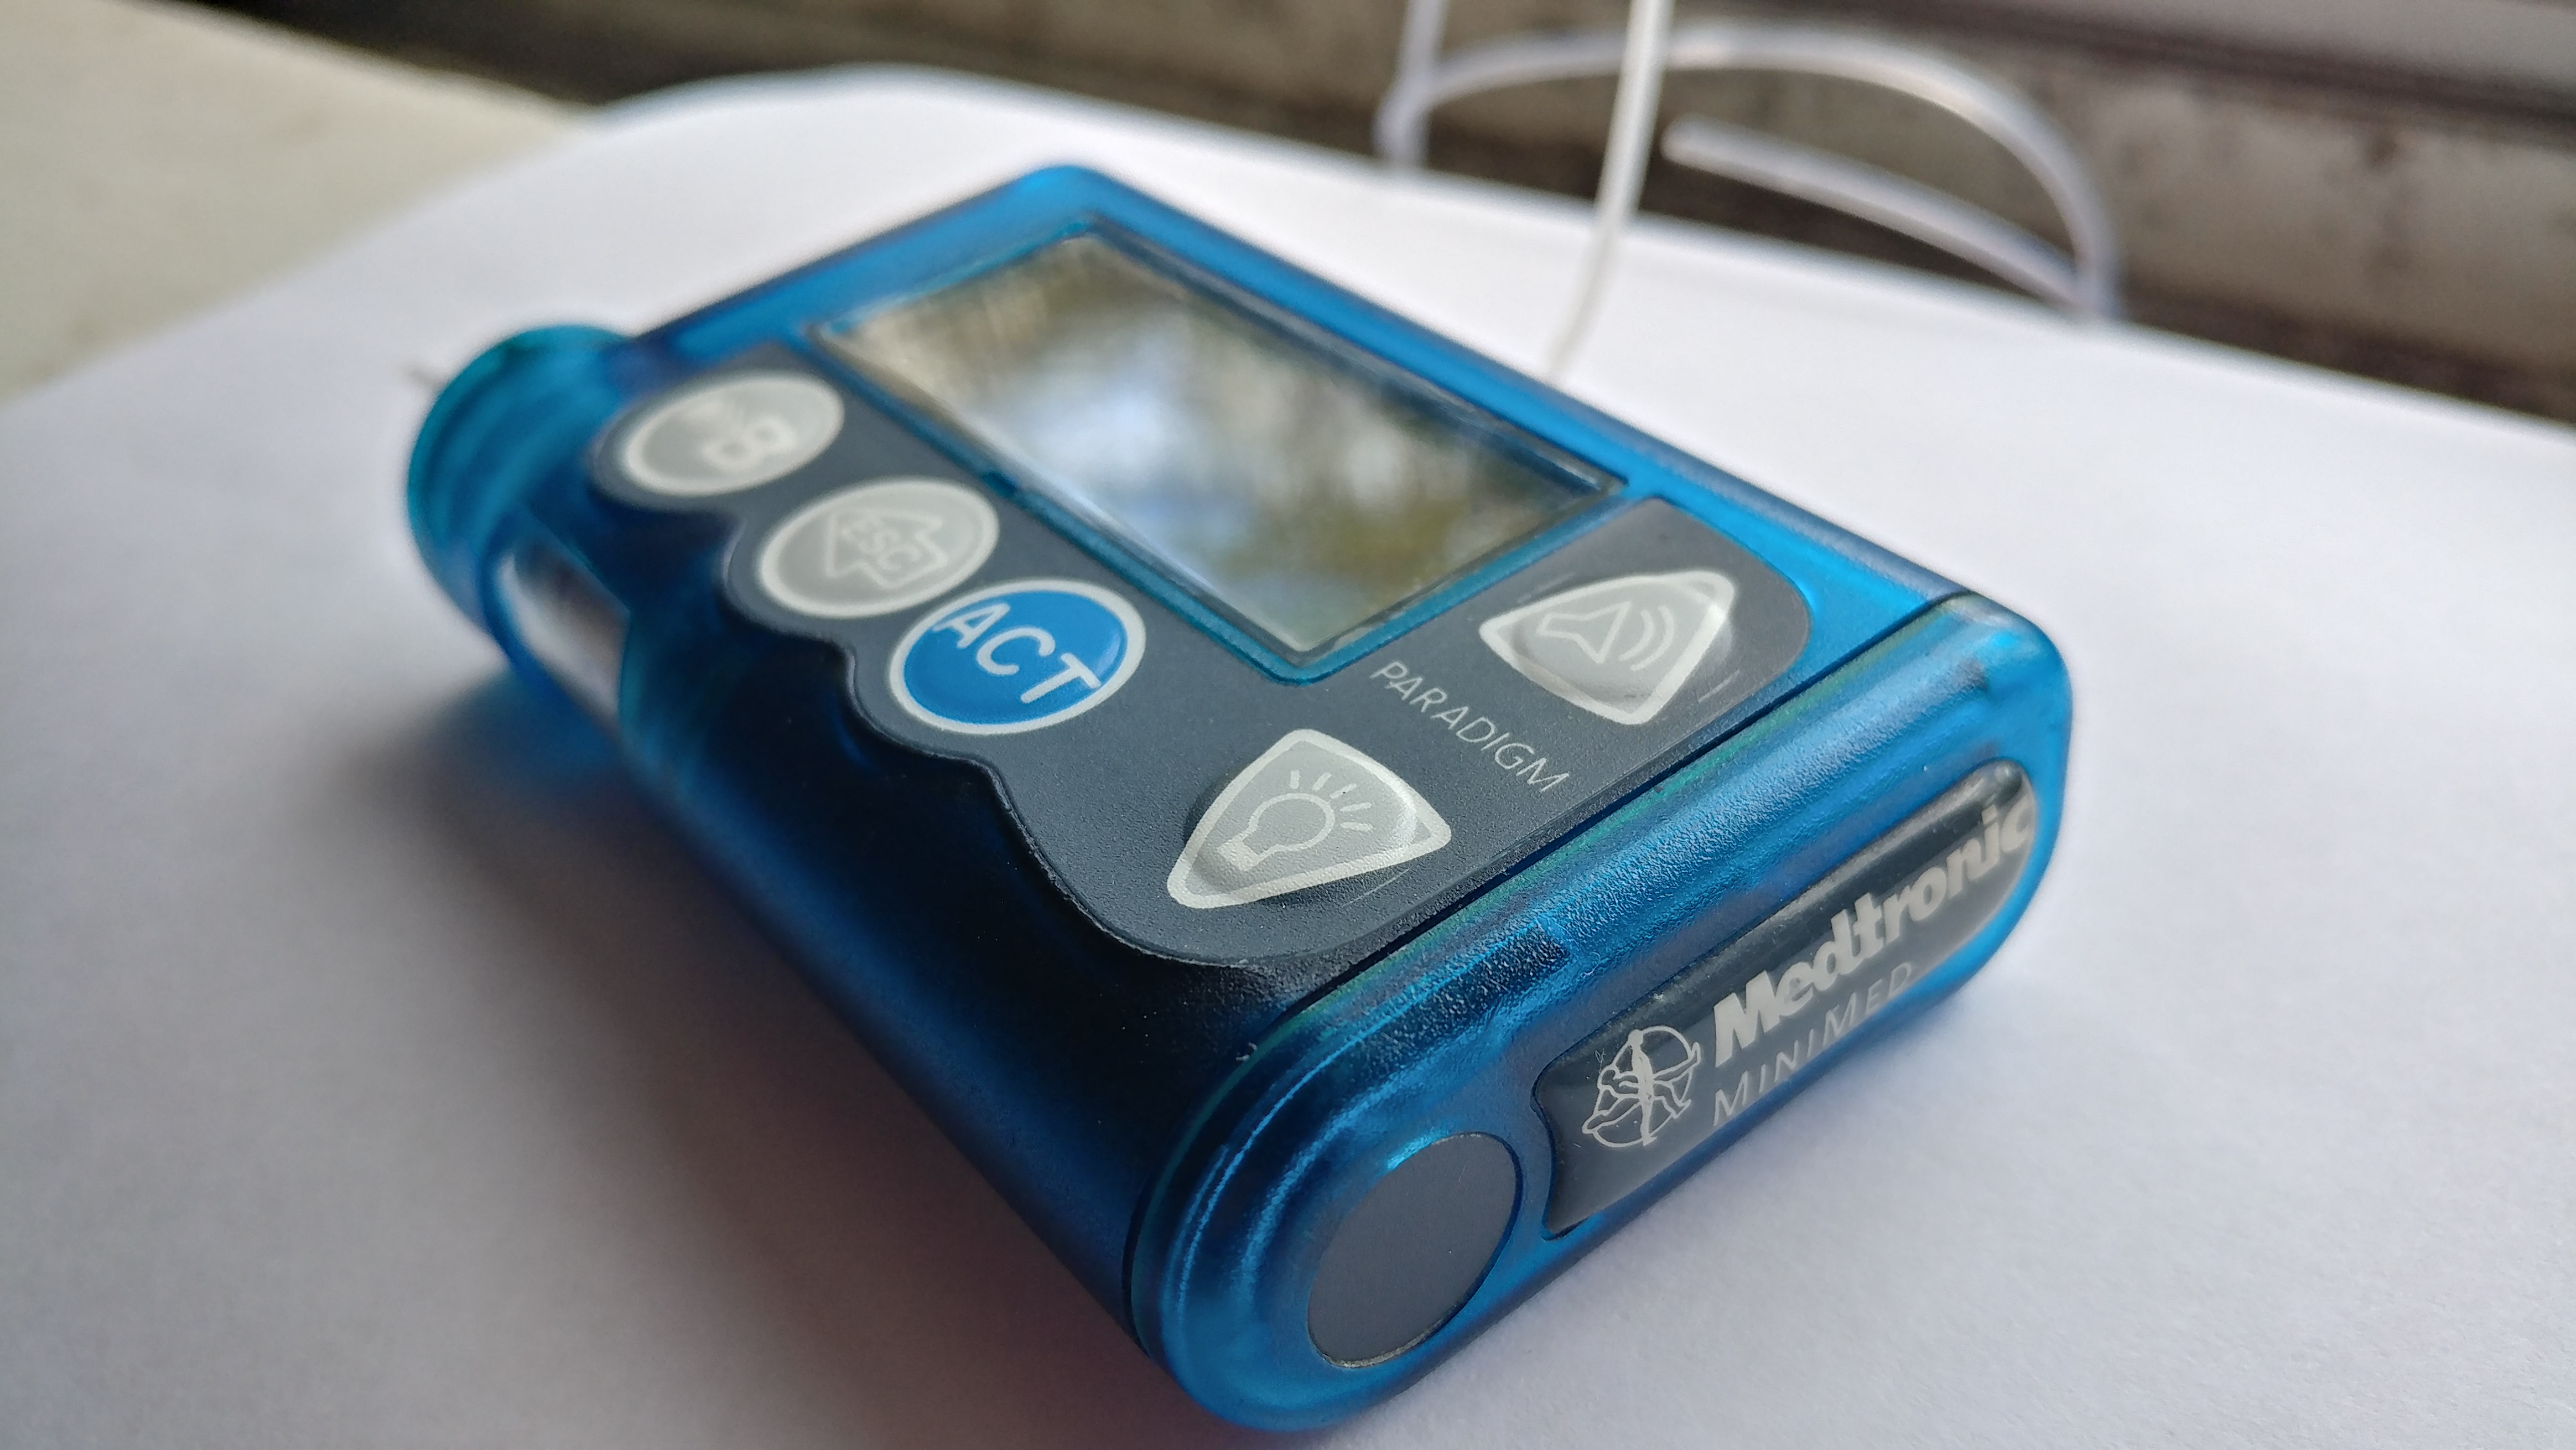
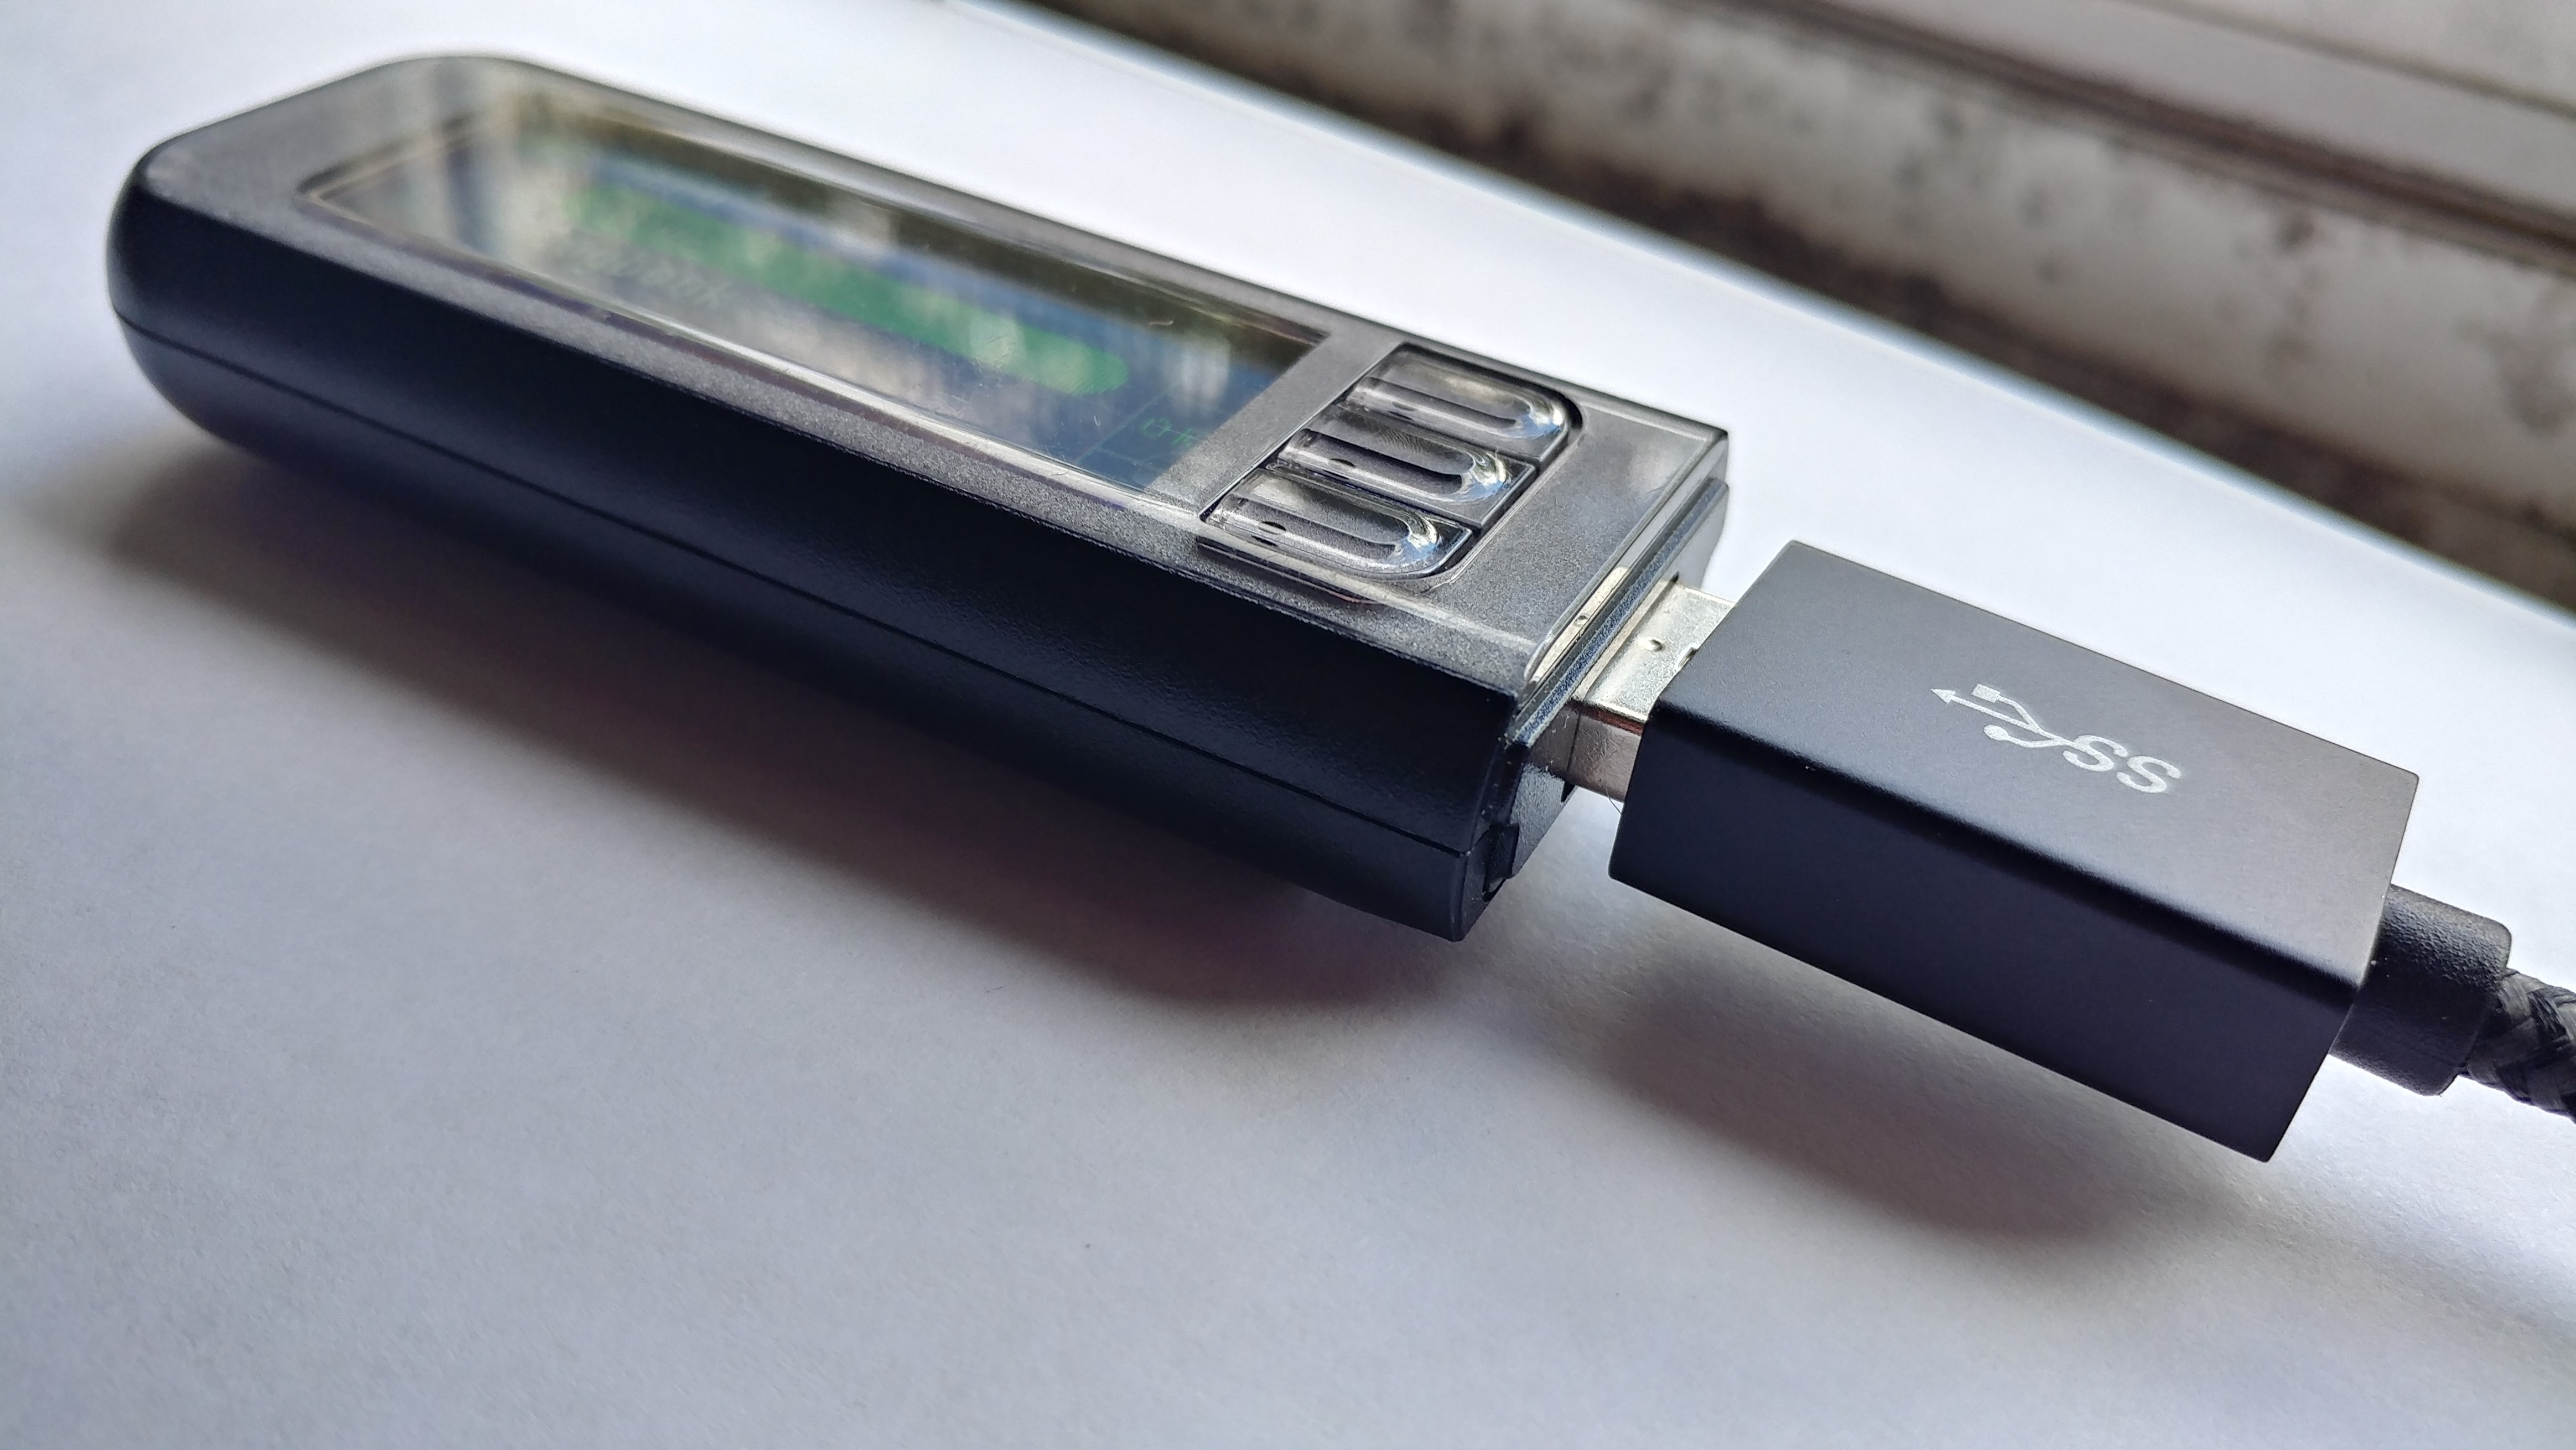
The NightScout mobile app pulls glucose values from the glucometer through and OTG cable to a phone.
OpenAPS runs a script that creates the Mongo database where we pull our data from.
The Google Sheets API and code we created to pull data from Mongo were written in Python.
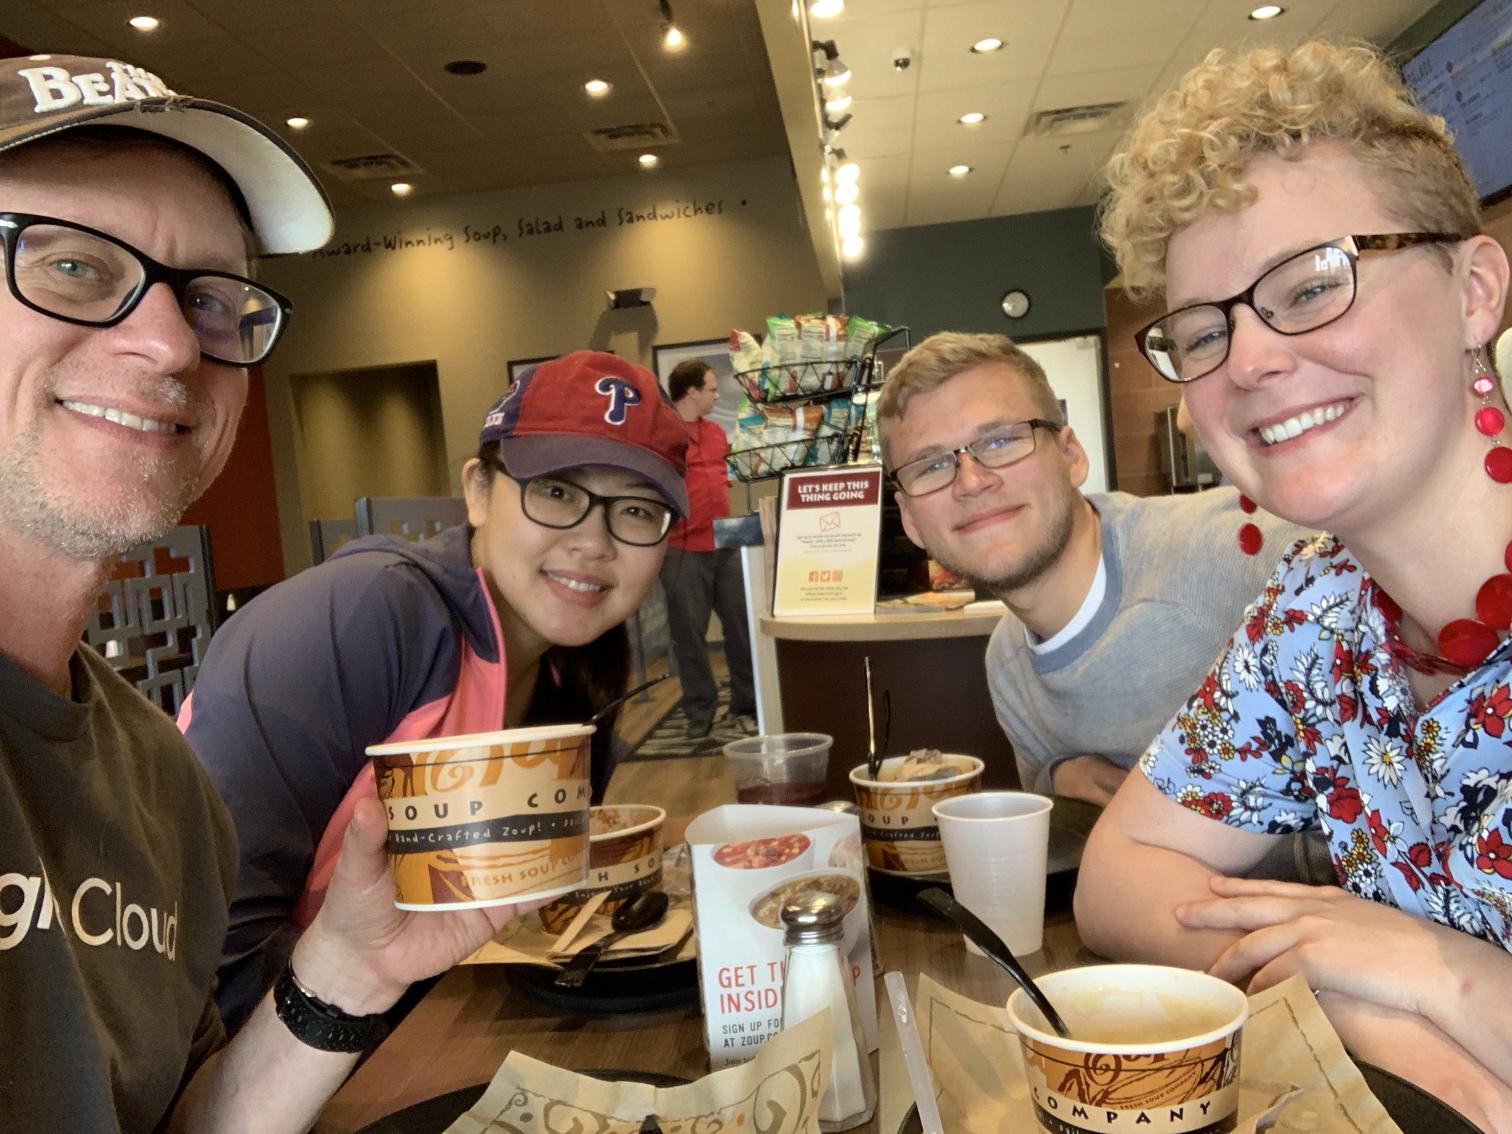
Kevin Tofel, Wanlu Ding, Sean Tinneny and Sarah Wagner
As part of our finished project we needed to create a video that demonstrates our finish product.
Over five weeks we grouped together to create our own real time graph that displays bloodsugar and insulin rates from an openAPS hacked insulin pump. We had to change our main lanuage from Java to Python halfway through. We ran into problems with hardware. We hit a few bumps in trying to figure out the database. However, at the end of this semester we pulled off what we set out to do. This video is a demo of how it all works.
View Video